Over the past few years, many large organizations have adopted business intelligence platforms like Tableau and are rolling them out to varying degrees of success. If your engagement has a heavy data analysis component, it’s highly likely that your clients will expect you to use toolkits like Tableau. If your competitors have already adopted these tools, they’ll have the capability to outperform you organization in terms of both quality and productivity. Tableau one of the most successful data visualization tools currently in use. In this post, I’ll discuss the dramatic impact it can have on your business.
What is Tableau?
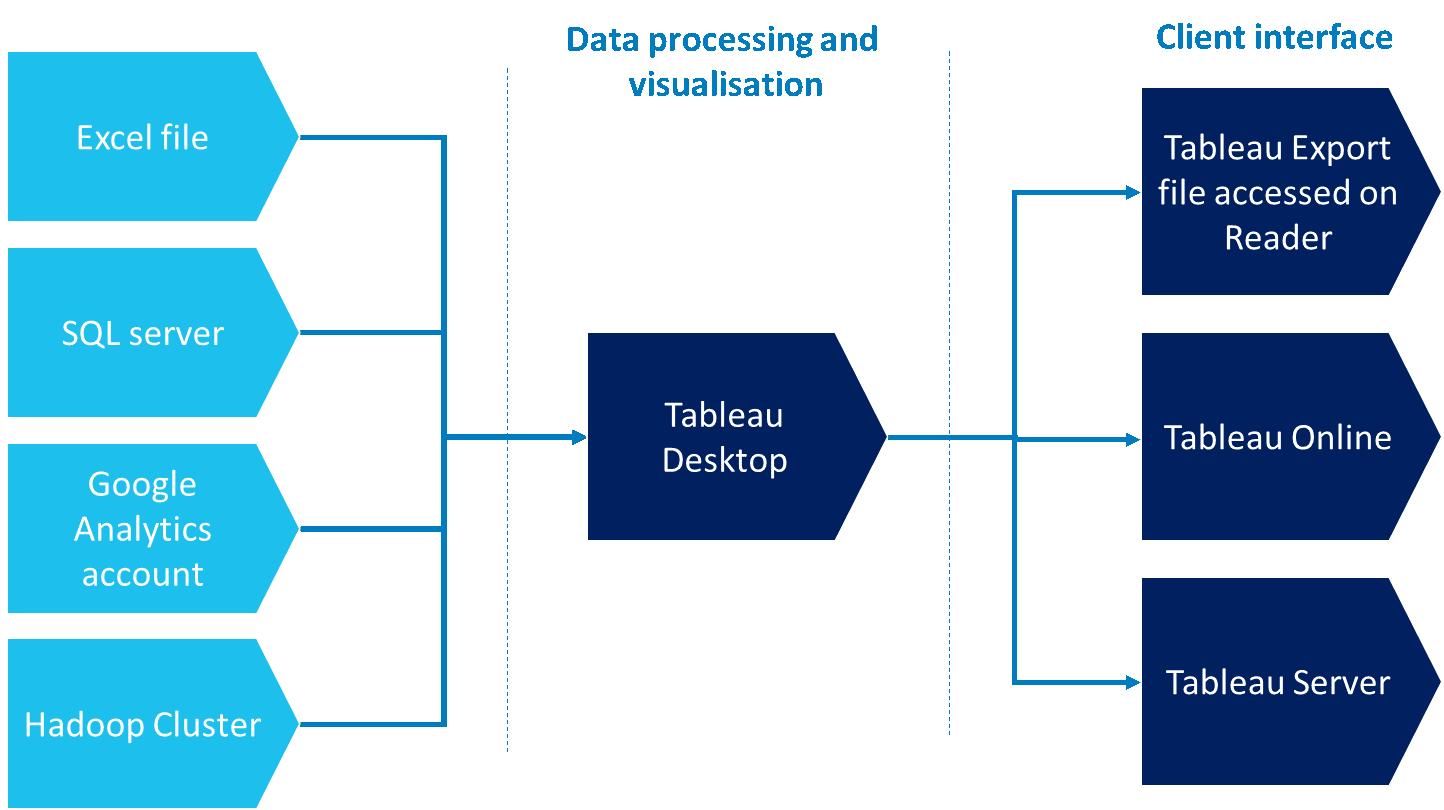
Tableau is a powerful data visualization software package that has engendered a huge following among data analysts in recent years. Tableau connects easily to nearly any data source, be it a corporate Data Warehouse, SQL Database, Microsoft Excel or web-based data. Tableau allows for instantaneous insight by converting data into visually impressive, interactive dashboards. This process takes only minutes or hours rather than weeks or months, radically improving the productivity of its users.
For analysts without a technical background, Tableau offers a huge boost in analytics capability, enabling users to manipulate multiple, large datasets in ways that were previously impossible with traditional tools such as Microsoft Excel.

Why Adopt Tableau?
Tableau provides 5 critical advantages over traditional analysis and visualization tools such as Microsoft Excel and PowerPoint. These advantages result in two major benefits for users: better quality of analysis and much higher productivity levels.
1. Access to large datasets
Microsoft Excel sheets are limited to just over 1 million rows. In truth, performance tends to drop well before this level. With Tableau, users can now manipulate much larger datasets, well over 100 million rows. This has implications for the quality of analysis that a user can produce. Instead of analyzing aggregate data (e.g. daily sales by store), users can now analyze transaction level data, generating much more granular insights and providing more value to clients.
2. Combining multiple datasets from different sources
As we’ve mentioned previously, Tableau enables users to quickly combine data from very different sources. Let’s take a simple example of a user that has 5 million rows of transaction data stored on a SQL server and a Microsoft Excel file containing monthly sales targets. These two data sources can now be compared in minutes to determine how the company has performed against expectations. Historically this would have been a much more arduous and time-intensive task and certainly not accomplished by a single business analyst without technical support.
3. Enhanced visualizations
Tableau has built its reputation on providing much improved visualizations from the traditional set of bar charts, line charts and pie charts. The software offers many more options that can release new insights from data that may not have become apparent with the limited set of traditional visualizations. In particular, Tableau’s ability to plot a large number of data points with visualizations such as the Packed Bubbles Chart significantly enhances the ability of users to analyze data more effectively.
4. Improved interactivity
Interactivity through filters, tooltips and map navigation provides users with much more power to quickly test new hypotheses, drill-down into specific data segments or remove outliers from their analysis. It also reduces the number of charts that need to be created in a document, which improves navigation and is much more intuitive for the client. Although traditional analysis tools have some basic interactivity, which are cumbersome to program, interactivity in Tableau is created in seconds.
5. Data updates are seamless and automated
With Tableau, data updates, be they daily or weekly are seamless. All visualizations and filters are updated automatically and any joins between data sources are not affected. What’s more, these updates are normally automated so the user may not even need to initiate the update. This can save huge amounts of time for repetitive analysis such as monthly KPI reports.
Does Tableau Replace Microsoft Excel?
There will always be a place for Microsoft Excel. Many client engagements do not require analysis of large complex datasets. Instead, they rely on simpler aggregate calculations or building financial models. In these engagements, Excel is still the best option. However, when large complex data sources are core to an engagement, Tableau is a much better alternative.
Is Tableau Easy to Use?
Unlike common software packages such as Microsoft Office, users of Tableau in professional services firms typically have little or no prior experience of the software, mainly due to the high price point. As a consequence, the need for training in Tableau is considerably higher. While these tools profess to be easy-to-use, they are not necessarily immediately intuitive and a steep learning curve does exist initially. For professional services firms to maximize the value of these products, early training should be mandatory for new users.
Another reason that training is particularly important is the nature of business intelligence itself. BI tools place more technical power in the hands of non-technical users, and a result, much of the analysis happens behind the scenes, such as joining an Oracle ESSBASE with a SQL Server. Unlike in Microsoft Excel where the raw dataset is always close at hand, mistakes in Tableau can actually be harder to identify because you are one step removed from the raw data.
Knowing how to watch for and correct these mistakes is critical to becoming a competent and reliable user of these products. For example, an analyst might forget to convert null cells to a zero value, thereby breaking an aggregate calculation performed on that column. In another instance, an analyst might place an incorrect join between two datasets, creating duplicate rows in the joined table and littering the resultant visualizations with errors. Needless to say, these errors can have reputational consequences for professional services firms.
A strong training program will help users avoid these mistakes and deliver high quality, reliable analysis.
How Do Organizations Currently Deploy Tableau?
Historically, business intelligence tools were considered ‘shelfware’. The software was purchased, used once and then put back on the shelf, never to be tried again. This reputation was partly deserved due to the poor user interface and training associated with early business intelligence products.
Although business intelligence products have improved enormously, the ‘shelfware’ pattern is still prevalent often in smaller organizations, where companies ‘road-test’ Tableau with a few licenses without a concrete set of use cases for the software. In reality, successful deployments of Tableau require large-scale adoption, accompanied with a specific set of tasks that will be performed by the Tableau teams and a comprehensive training plan for each user.
Why Wait?
You shouldn’t! To stay ahead of both your clients and your competitors, it’s imperative for professional services firms to adopt business intelligence suites like Tableau.


